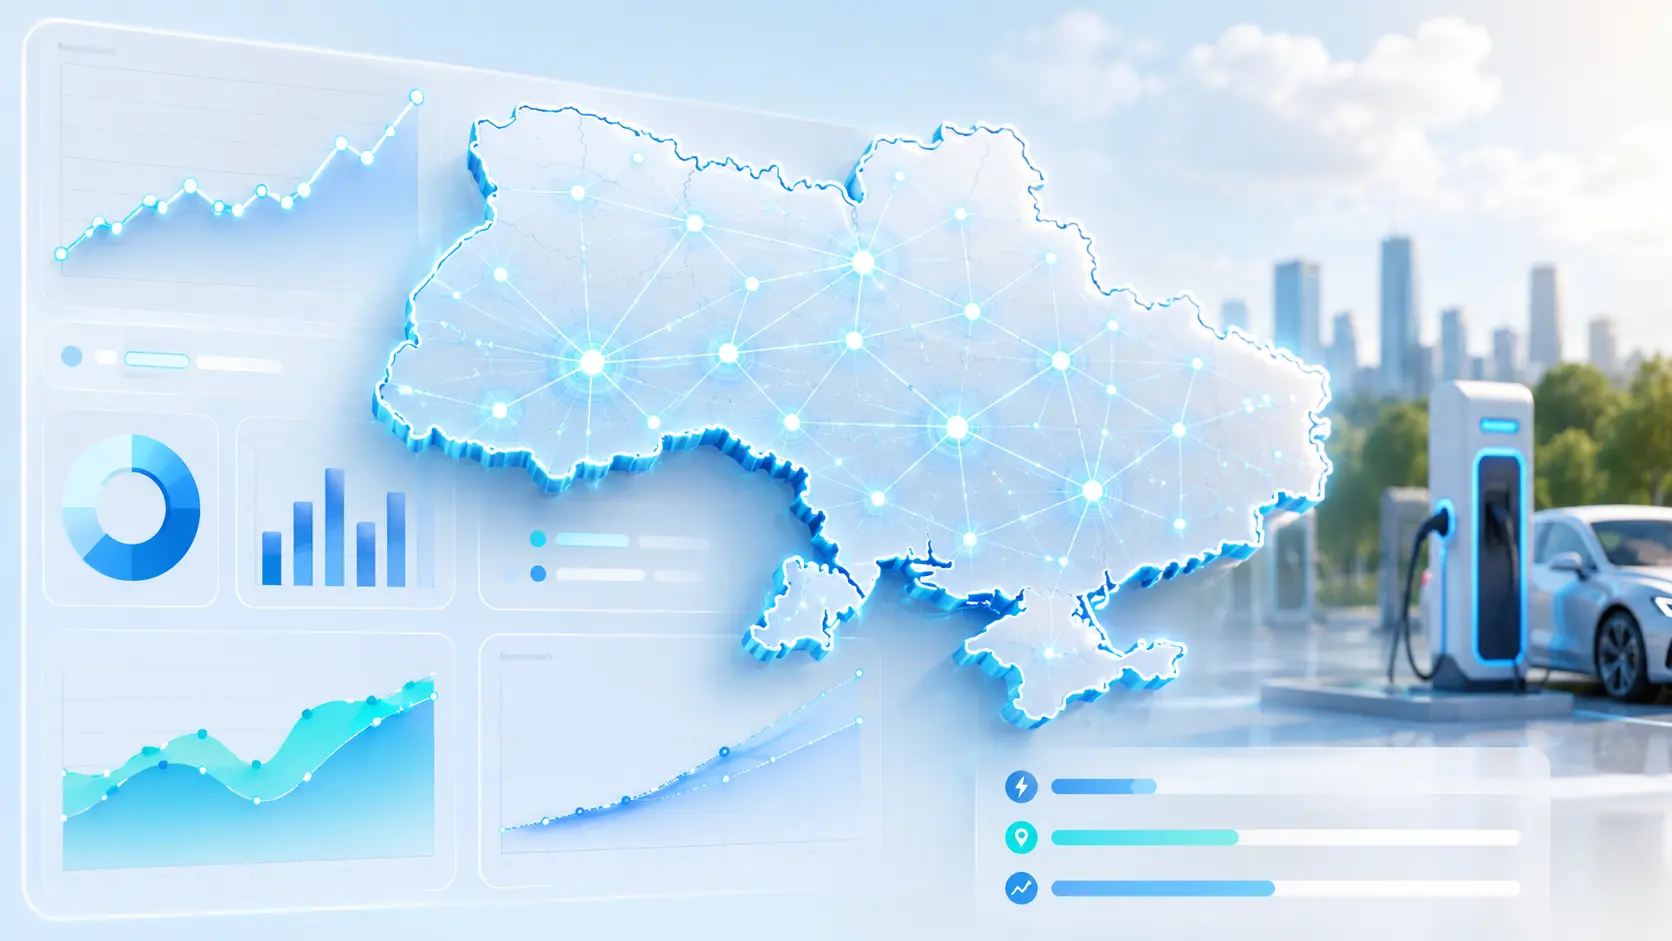



Public operator statistics for Ukraine
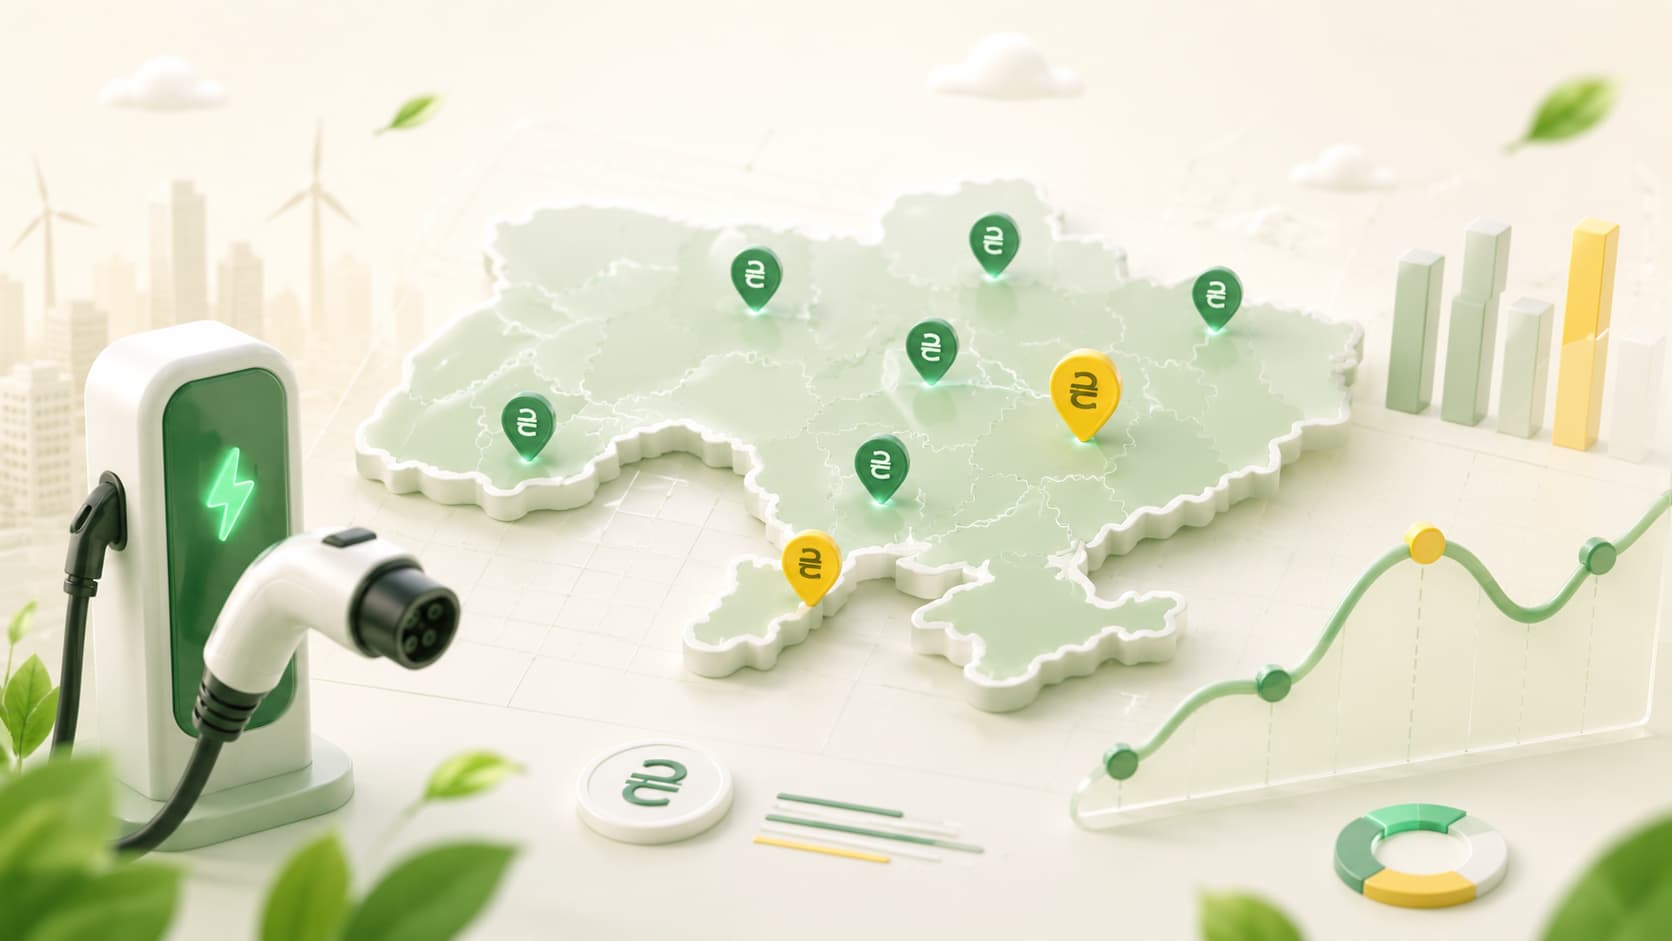
An analytical review of fast charging infrastructure by EVBOOST. The sample includes only high-power public sites with total power40 kW. The data is aggregated directly from the station registry and updates automatically.
Operator charts
Top operators by number of locations
Shows the scale of the high-power network: only 40+ kW locations are counted.
Top operators by total power
Gives a truer picture of a network’s capacity than a simple count of points.
Growth of each operator
Month-by-month locations and total power for the largest billing operators.
Growth in the number of stations
The cumulative number of public locations for each operator.
Growth in total power
Cumulative network power for each operator, MW.
DC connectors
A public snapshot of active DC connectors: the number of guns, locations, operators and total power.
Market structure by power class
Split only between 40–149 kW, 150–239 kW and 240+ kW locations.
Top operators by 240+ kW
A separate cut of the most powerful, ultra-fast segment.
Locations × power
X — number of locations, Y — total power, bubble size — number of connectors.
Leaders by total power
The operators with the highest total power across 40+ kW locations.
What stands out
The page shows not just “who has how many stations”, but the quality mix of public fast infrastructure.
Power matters more than count
An operator may have fewer locations yet substantially more real charging capacity.
40–149 kW — the basic fast segment
This class makes up the bulk of the market’s public fast charging infrastructure.
150–239 kW — the HPC segment grows
Hyper-fast locations show which operators are scaling modern charging corridors.
240+ kW — the premium segment
Ultra-fast locations are a marker of an operator’s ambition and network quality.
The full operator table
Sorted by total power of 40+ kW locations, from highest to lowest.
| # | Operator | Total power |
Locations | Connec tors |
Average kW / location |
40–149 kW |
150–239 kW |
240+ kW |
|---|
Methodology
The statistics show a public snapshot of Ukraine’s fast charging infrastructure. The sample includes only locations with power40 kW, that have an operator and are located in Ukraine.
- Locations— the number of an operator’s public charging locations withwith power ≥ 40 kW.
- 40–149 kW— fast locations.150–239 kW— hyper-fast.240+ kW— ultra-fast.
- ROAMING— operators where charging can be started through EVBOOST Roaming.